Welcome to Part 3 of our Tech Hub Showdown series that compares Ottawa, Ontario, with American tech hotspots. In previous face-offs, Canada’s capital went up against Austin, Texas and Boston, Massachusetts. Next to step into the ring is Denver, Colorado.
Ottawa is a tech powerhouse with the second-highest concentration of scientists and engineers in North America. For today’s showdown, we’ve compared data on Ottawa and Denver’s economies and workforces to help you choose your ideal location to live, learn, and grow in tech.
Round 1: Quick facts
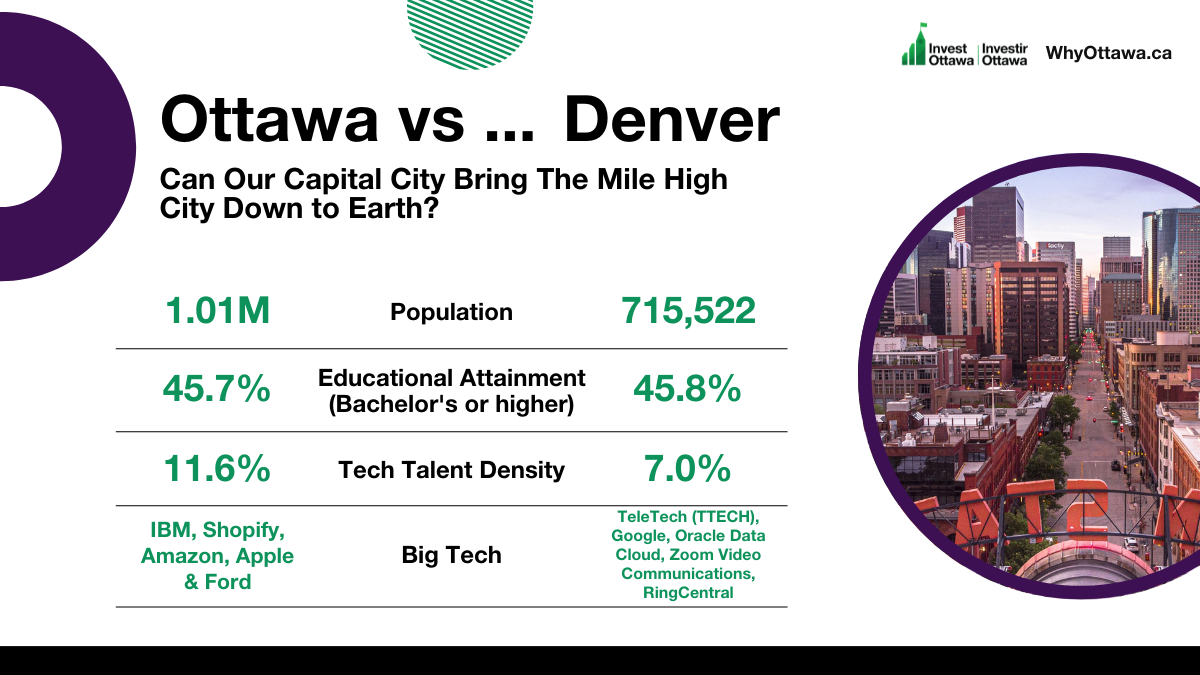
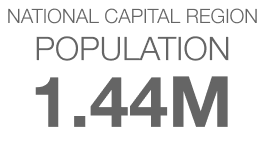
Geographically, Canada’s Capital Region spans across a greater area and is more than 11 times the size of Denver. About 1.44 million people live in the National Capital Region.1 Denver’s population is approximately half that with 715,522 residents, but 2.9 million live within its metro area (US Metropolitan Statistical Areas tend to take in a larger area than Stats Canada’s equivalent). 2 Ottawa and Denver are well-educated cities with approximately 46% of their grads holding at least a Bachelor’s degree.3
Denver is known for its scenic nature surroundings that make it a wonderful place to live and work. Some of the city’s incredible natural wonders include the Red Rocks, the striking foothills known as The Flatirons, and Rocky Mountain National Park. Ottawa is a beautiful city too, with no shortage of natural wonders. The city has more than 1,000 parks, four beaches, and many cycling and walking paths. The historic Rideau Canal winds through the city centre, with walking and cycling paths on both sides. In winter, the canal turns into the world’s longest skating rink.
Both cities are home to tech giants and major software companies. In November 2021, two Ottawa and Denver global telecommunications brands came together when Ottawa’s Mitel and Denver’s Ring Central announced a strategic partnership, in which RingCentral is now Mitel’s exclusive UCaaS partner.
Round 2: Tech talent density
Ottawa’s tech talent concentration is among the highest in North America, with approximately 11.6% of the population working in tech compared to Denver’s 7%.4
Tech workers come here for school, career opportunities, and our quality of life. Ottawa is ranked as a top three city in North America for quality of living (Mercer), and in 2020, Expert Market ranked Ottawa as Canada’s Best Tech Hub to Live and Work In.
Round 3: Tech talent score (CBRE)
Ottawa ranked #10 on CBRE’s 2021 North American Scoring Tech Talent, moving up four spots from 2020.
Ottawa ranked #1 in tech employment concentration, and ranked high on affordability based on our combined labour and real estate costs. Denver came in just under Ottawa, ranking #12 on CBRE’s list.5
Round 4: Business costs
You’ll save about $4-5 per square foot of office space in Ottawa compared to Denver. A square foot of office space in Ottawa costs $25.14, in Denver, it will cost you about $29.11. 6
Ottawa is the least expensive city in North America according to Mercer, which means your money goes further. The average tech salary in Ottawa is US $68,000. Denver’s average cost of talent acquisition is much higher with the average tech salary at US $97,000. 7
Round 5: Labour market
Ottawa had a net gain of 5,466 more tech jobs between 2016 and 2020 than there were graduates in the city. Denver had 5,344 more tech jobs than graduates. Both cities are keeping and attracting new talent, which is a sign of a healthy tech labour market.8
Ding, ding, ding…
More talent. More savings. Ottawa’s hand gets raised in this showdown.
Want more comparisons? Stay tuned for our next Tech Hub Showdown: Ottawa vs. Silicon Valley (Bay Area).
For more information on how you can make Ottawa your next business destination, contact our Global Expansion Team today.
Sources
1 Statistics Canada. (2021). Population estimates, July 1, by census metropolitan area and census agglomeration, 2016 boundaries [Data table]. https://www150.statcan.gc.ca/t1/tbl1/en/tv.action?pid=1710013501
2 Data Commons. (2020). Denver. https://datacommons.org/place/geoId/08031?utm_medium=explore&mprop=count&popt=Person&hl=en
3 CBRE. (2021). CBRE Scoring Tech Talent 2021, Figure 4. https://www.cbre.us/-/media/cbre/countryunitedstates/us-research/major-reports/2021/scoring-tech-talent-media-folder/2021-scoring-tech-talent.pdf
4 CBRE. (2021). CBRE Scoring Tech Talent 2021, Figure 3. https://www.cbre.us/-/media/cbre/countryunitedstates/us-research/major-reports/2021/scoring-tech-talent-media-folder/2021-scoring-tech-talent.pdf
5 CBRE. (2021). CBRE Scoring Tech Talent 2021, Figure 2. https://www.cbre.us/-/media/cbre/countryunitedstates/us-research/major-reports/2021/scoring-tech-talent-media-folder/2021-scoring-tech-talent.pdf
6 CBRE. (2021). CBRE Scoring Tech Talent 2021, Figure 21. https://www.cbre.us/-/media/cbre/countryunitedstates/us-research/major-reports/2021/scoring-tech-talent-media-folder/2021-scoring-tech-talent.pdf
7 CBRE. (2021). CBRE Scoring Tech Talent 2021, Figure 19. https://www.cbre.us/-/media/cbre/countryunitedstates/us-research/major-reports/2021/scoring-tech-talent-media-folder/2021-scoring-tech-talent.pdf
8 CBRE. (2021). CBRE Scoring Tech Talent 2021, Figure 6. https://www.cbre.us/-/media/cbre/countryunitedstates/us-research/major-reports/2021/scoring-tech-talent-media-folder/2021-scoring-tech-talent.pdf