


Welcome back to our Tech Hub Showdown series that compares Ottawa, Ontario, with American tech hotspots. In Part 1, Ottawa faced off against Austin, Texas. Next to step into the ring is Boston, Massachusetts.
Ottawa’s tech talent, competitive business costs, and quality of life attract companies and investment from around the world. Let’s see how “Beantown” stacks up.
Round 1: Quick facts
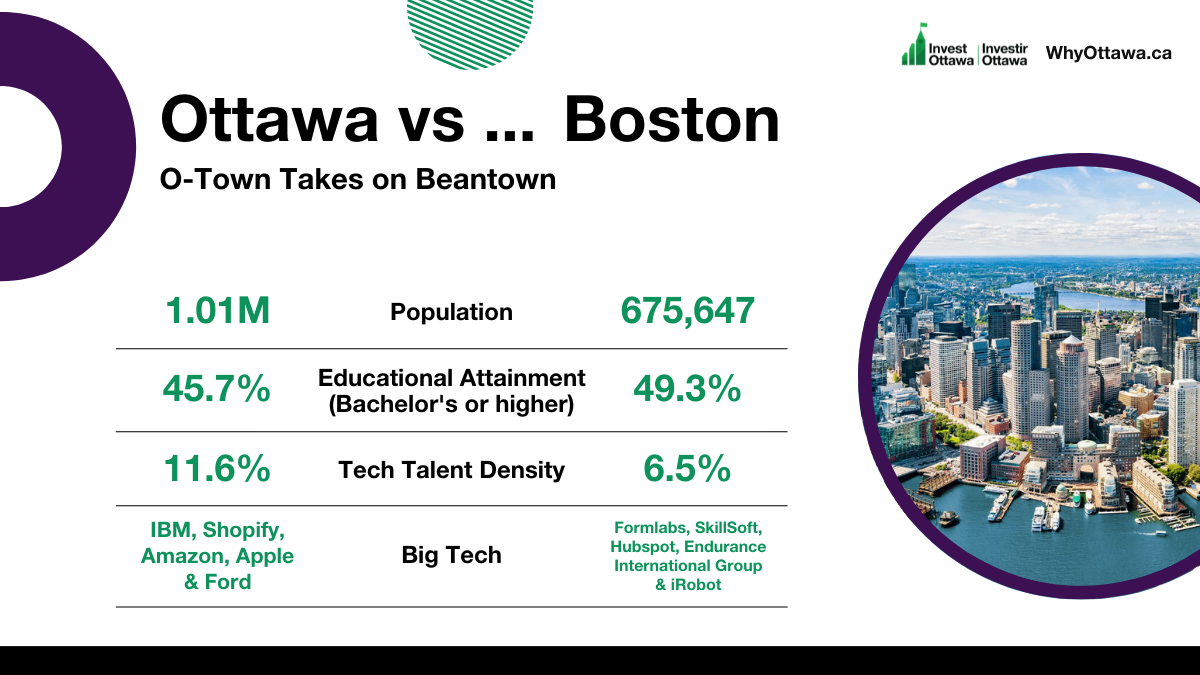
Canada’s capital city is centered between the country’s two largest cities, Montreal and Toronto. The National Capital Region, which contains the cities of Ottawa, Ontario and Gatineau, Quebec, has a population of 1.44 million.1 Boston is the largest city in Massachusetts with 675,647 residents and a metro population of 4.9 million (US Metropolitan Statistical Areas tend to take in a larger area than Stats Canada’s equivalent).2 Geographically, the National Capital Region is much larger — more than 20 times the size of Boston.
Boston is famous for its world renowned post-secondary institutions, such as Harvard University, Massachusetts Institute of Technology , and Boston University. Harvard was the first university built in the United States and its influence, reputation, and top education attracts students from all over the world. MIT is driving innovation in space exploration; four of the 12 astronauts who walked on the moon during the Apollo program were MIT alumni. Boston University’s highly ranked graduate schools include the School of Law, School of Management, School of Medicine, College of Engineering, and School of Education.
Ottawa has its own globally-recognized post-secondary institutions: University of Ottawa, the largest bilingual (English/French) university in the world; Carleton University, one of Canada’s most funded universities for research and development; Algonquin College, the largest college in eastern Ontario with more than 180 programs; and Collège La Cité, the largest French-language college in Ontario. Both cities are well-educated; however, Ottawa has nearly double the number of grads (658,080) holding at least a Bachelor’s degree compared to Boston (334,094).3
With its high performing tech sector, Ottawa is a leader in scaling companies and taking them to public markets. Homegrown software companies include Halogen (now Saba), Kinaxis, and Shopify. Ottawa’s Shopify has emerged as one of the most exciting global players in the SaaS space with its cloud-based e-commerce platform. Shopify serves businesses across 150 countries, and is one of Canada’s top R&D spenders along with Mitel Corporation. Boston’s tech companies include FormLabs, a 3D printing technology developer and manufacturer, HubSpot, a marketing and sales software, and iRobot, a robotics and software company.
Round 2: Tech talent density
Ottawa has nearly double the amount of tech pros (11.6%) compared to Boston (6.5%).4 Ottawa is a globally-recognized tech hub that attracts students and professionals from around the world.
Ottawa’s major tech fields include life sciences, software, digital media, clean technologies, aerospace, defence, and security, and connected and autonomous vehicles. Evolving from the Ottawa L5 Connected and Autonomous Vehicle (CAV) Facility, Area X.O offers a secure and safe environment to create, test, and demonstrate mobility, autonomy, and connected technologies.
Round 3: Tech talent growth
According to CBRE’s yearly tech talent report, tech employment in Ottawa grew by 22.5% between 2015 and 2020. Within the same five-year period, Boston’s tech talent grew by 7.2%.
Ottawa’s innovation ecosystem has been building up our tech talent pool with 65 federal research labs and many top-tier STEM programs.
Round 4: Business costs
The Canadian dollar makes setting up shop in Ottawa less expensive. The annual asking rent per square foot of office space in Ottawa is $25.14. In Boston, you would pay $41.98 per square foot.5 You can take that extra 41% of savings on rent and reinvest it in your business.
Ottawa is the least expensive major city in Canada, which is a win-win for employees and employers. Residents pay less for rent, and employers pay less in talent costs.
Ottawa’s tech pros have an average salary of US $68,000. In Boston, tech pros make over six figures with a US $114,000 annual salary.6
Round 5: Labour market
Ottawa’s labour market is strong and stable with a net gain of 5,466 more tech jobs added between 2016 and 2020 than there were graduates in the city.7 Ottawa tends to keep its talent and attracts new talent to the area from all over the world.
By comparison, Boston had 37,000 more tech jobs than graduates in the city.7 With this much competition, hiring top talent can be more challenging and expensive for growing companies.
Ding, ding, ding…
Ottawa beats Boston to the punch when it comes to tech talent and affordability,
Want more comparisons? Stay tuned for our next Tech Hub Showdown: Ottawa vs. Denver, Colorado.
For more information on how you can make Ottawa your next business destination, contact our Global Expansion Team today.
Sources
1 Statistics Canada. (2021). Population estimates, July 1, by census metropolitan area and census agglomeration, 2016 boundaries [Data table]. https://www150.statcan.gc.ca/t1/tbl1/en/tv.action?pid=1710013501
2 Data Commons. (2020). Boston. https://datacommons.org/place/geoId/2507000?utm_medium=explore&mprop=count&popt=Person&hl=en
3 CBRE. (2021). CBRE Scoring Tech Talent 2021, Figure 4. https://www.cbre.us/-/media/cbre/countryunitedstates/us-research/major-reports/2021/scoring-tech-talent-media-folder/2021-scoring-tech-talent.pdf
4 CBRE. (2021). CBRE Scoring Tech Talent 2021, Figure 3. https://www.cbre.us/-/media/cbre/countryunitedstates/us-research/major-reports/2021/scoring-tech-talent-media-folder/2021-scoring-tech-talent.pdf
5 CBRE. (2021). CBRE Scoring Tech Talent 2021, Figure 21. https://www.cbre.us/-/media/cbre/countryunitedstates/us-research/major-reports/2021/scoring-tech-talent-media-folder/2021-scoring-tech-talent.pdf
6 CBRE. (2021). CBRE Scoring Tech Talent 2021, Figure 19. https://www.cbre.us/-/media/cbre/countryunitedstates/us-research/major-reports/2021/scoring-tech-talent-media-folder/2021-scoring-tech-talent.pdf
7 CBRE. (2021). CBRE Scoring Tech Talent 2021, Figure 6. https://www.cbre.us/-/media/cbre/countryunitedstates/us-research/major-reports/2021/scoring-tech-talent-media-folder/2021-scoring-tech-talent.pdf